
What is Player? Conventional Exploration
Player is  the gold standard tool for Play Analysis in the upstream oil and gas industry today with 30+ international E&P companies now using our product. Our client base comes from the full spectrum of oil and gas companies actively exploring almost every basin globally, from small independents through to global supermajors.
The play analysis process in a conventional play setting as seen in Player forces the evaluation team to look at and understand why nearby wells have succeeded or failed in a critical way. Player translates this and other knowledge from seismic and well data into a set of maps that helps to spatially divide any reservoir/seal pair (or play interval) into good or bad areas. This mapping process can be qualitative or quantitative and many companies have developed their own processes and workflows which we can emulate by customizing the Player software to each company.
What is Player? – Player is our flagship ArcGIS extension in ArcDesktop that helps geologists qualitatively or quantitatively evaluate the potential of both conventional and unconventional plays. Our customers typically have historical maps, evaluations, spreadsheets and databases that we import into a new project that is built around well, field and block data from IHS or Wood Mackenzie subscription data. This build process has been streamlined in the case of IHS data so that user defined play divisions loaded with IHS pool data can be made into a project in less than 30 minutes. We teach your GIS/support people how to do this so that you can make projects over any area for any play interval set anytime you wish.
The Player product is sold as a regional license and can be leased or purchased. It is delivered as a node-locked (single PC) license or as a floating network license.
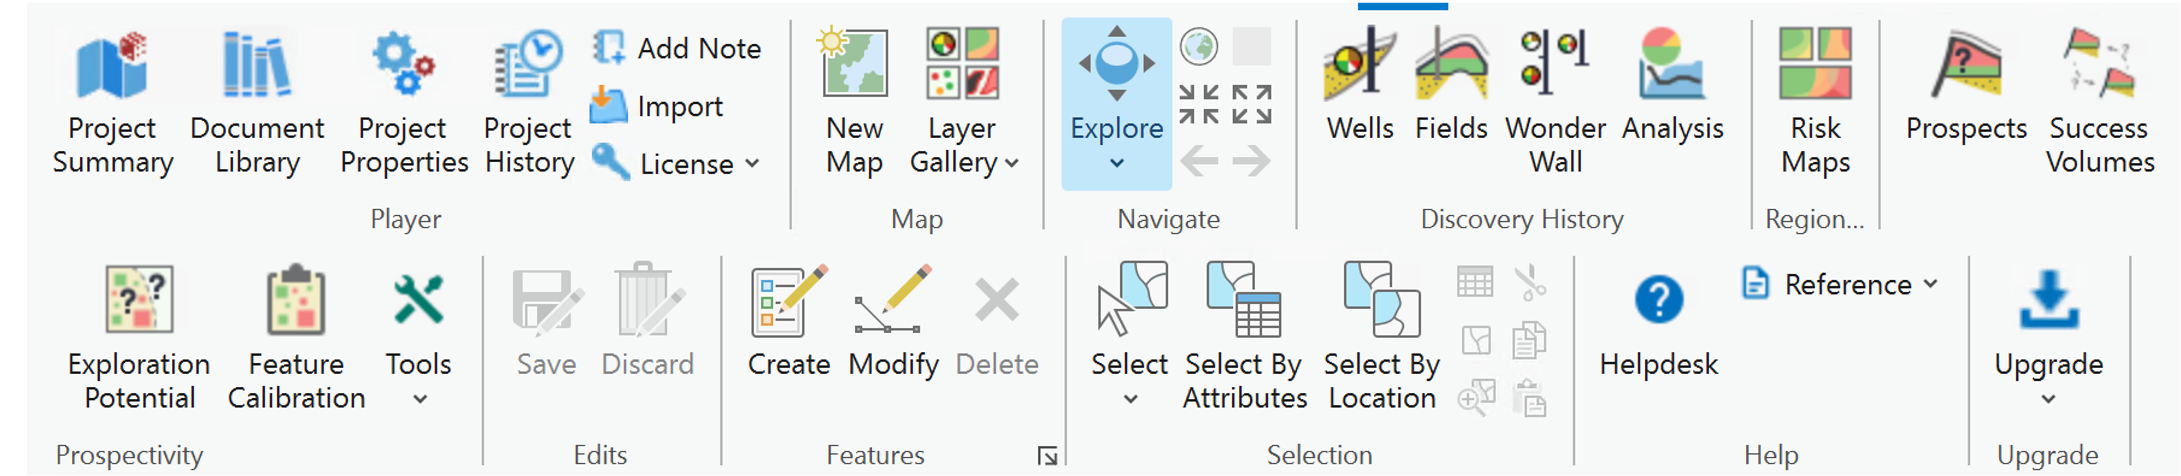
Player has the full set of conventional discovery, well failure, and prospect tools that are needed to properly evaluate conventional plays. The full workflow with an explanation of the detailed elements is summarised below:
Player has been designed to quickly collect the prospectivity data. Player is not competing with detailed prospect volumetric tools which are best applied to features in the possible drill sequence rather than on screening level prospectivity assessments. We have built links to all the major prospect tools used in the industry today including MMRA and Geox.
The Player concept is to use simple screening volumetric tools to collect all the identified prospectivity quickly and efficiently and then in time only a subset of these will be high graded for drilling. As an industry we spend a disproportionate amount of resources making these detailed volumetric estimates. At GIS-PAX, we think it’s better to initially capture more prospects and leads quickly rather than spend a significant amount of time analysing a few that may have been arbitrarily and wrongly high-graded.
The Key to Success- Well Failure Analysis
Regardless of the play map type selected (traffic light vs. split risking) the evaluation process can be described in many ways. We need to understand which plays (and trap types) have been tested- where and when? which have worked? Why we think different plays have failed in different areas?
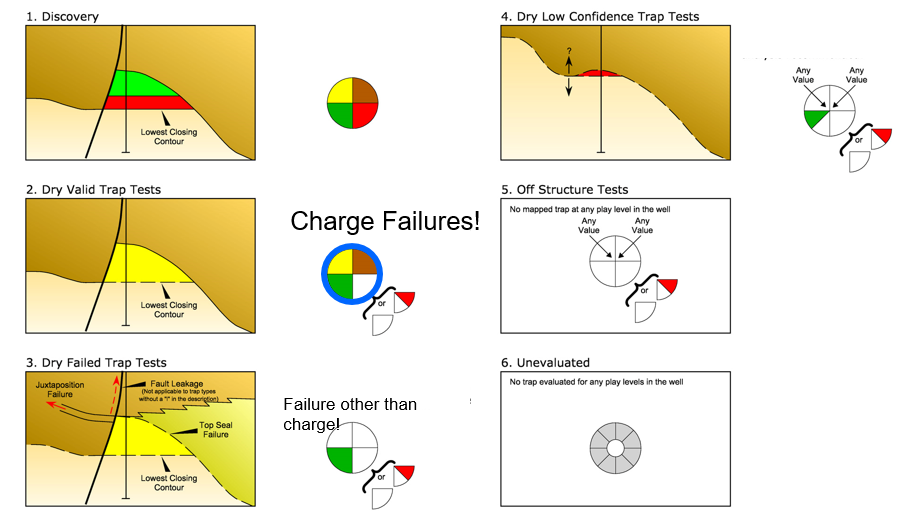
The first step is to load all of the vendor discovery data into your play divisions. After this, the data is edited and your proprietary data is added allowing you to correct any inaccuracies. This enables you to see, for each interval, where the hydrocarbons are and where the wells have failed. We then evaluate the well failures using our proprietary scheme shown below:
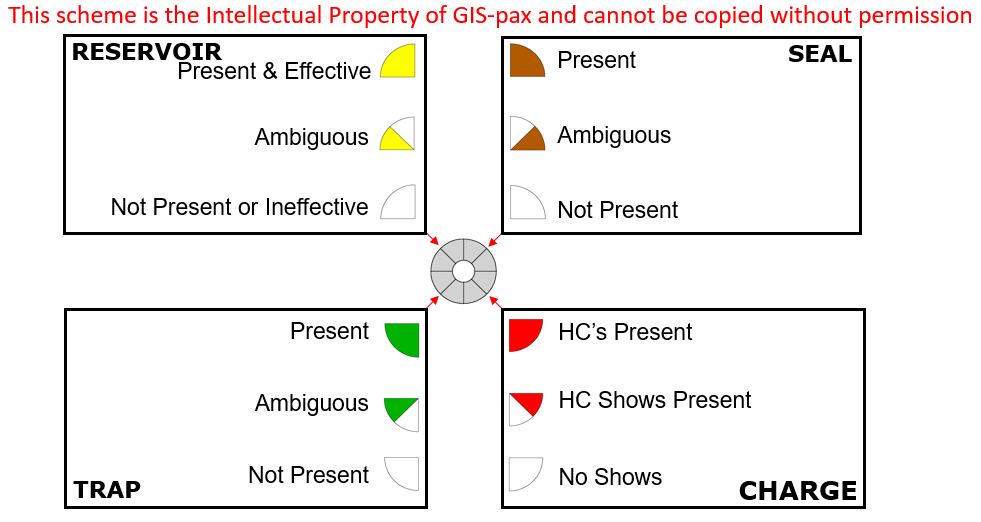
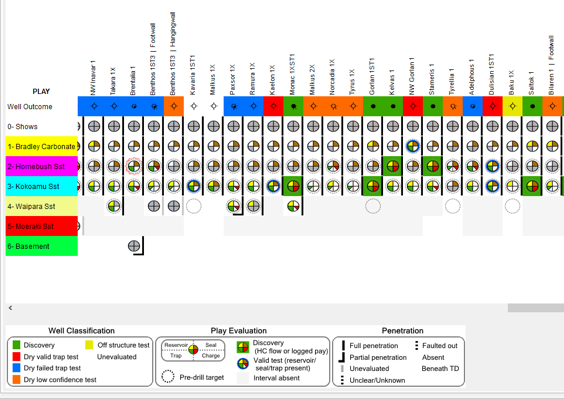
This scheme is very deliberate and powerful; this data, along with the penetration data, is made into what we call a “wonderwall” plot to collate and show/document this critical but ever changing dataset. Essentially, this is where you collect and save your corporate knowledge…
The ‘wonderwall’ displays and communicates an amazing volume of exploration detail in a single format…
Many people are intimidated by the perception of the amount of work and resources the post well analysis will take but geologists quickly learn that in basins with hundreds or even thousands of wells you can focus your efforts quickly on a selection of key wells and plays after considering the following factors:
- Which are the key plays and areas you want to work/analyse? – this is normally a combination of the established plays, the plays where your company or JV has mapped leads or prospects and/or the plays that you can see are still growing. This generally results in limited areas or subsets of blocks where you will focus your initial work..
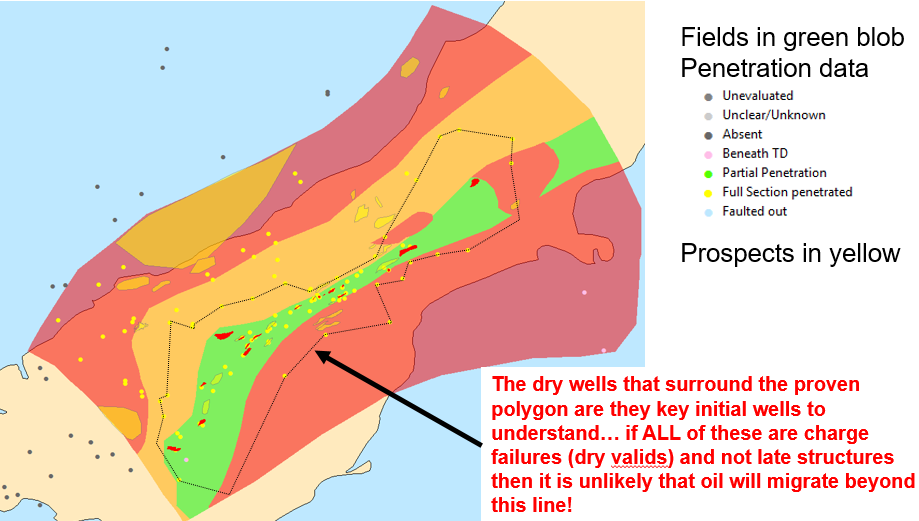
- Which are the key wells to review? – these are comprised of key stratigraphic wells that drill deep through multi-play intervals and help define the stratigraphy, the wells close to or in your focus block or license areas, and wells on the “edge” of proven play areas. This latter type of well is key as it is easy in a play to define where the pools and hence the proven play area is even without any reservoir seal or charge data. This is typically the green blob on traffic light maps and is the 100% play polygon on split risk maps. Immediately around this polygon if you have a number of wells then if they are all “dry valids” using our post well analysis nomenclature (as long as they are not late structures) the proven charge/play polygon is between the fields and the dry wells (as per example figure below). However, if they are all failed trap, low confidence or off structure tests then it’s possible that the play could extend over a significantly larger area. In the real world there is typically an imperfect dataset and a variety of failure types but normally you can work out which area has the best potential for a play extension.
In short you don’t try and evaluate every well and every play at the start of your evaluation. What happens in many core areas is that different blocks and plays are evaluated separately over time and eventually after a few years you will have a regional coverage and insight effectively at no additional cost. Once you have this framework you simply add wells as they are drilled to keep your evaluation up to date.
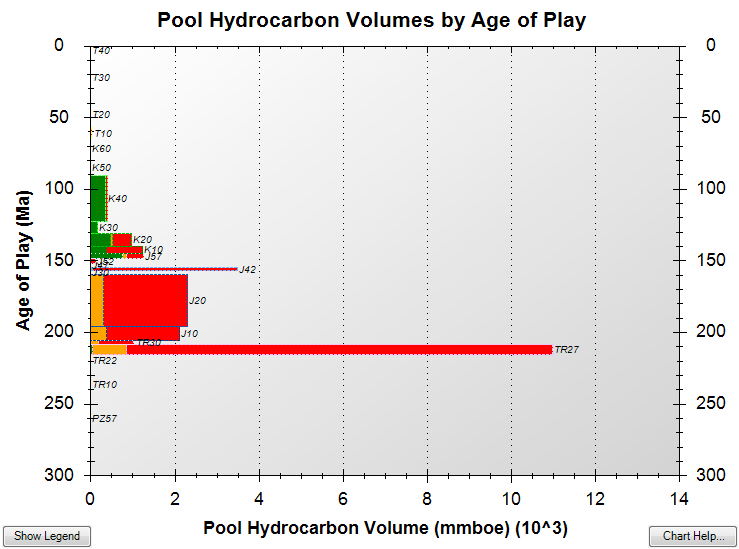
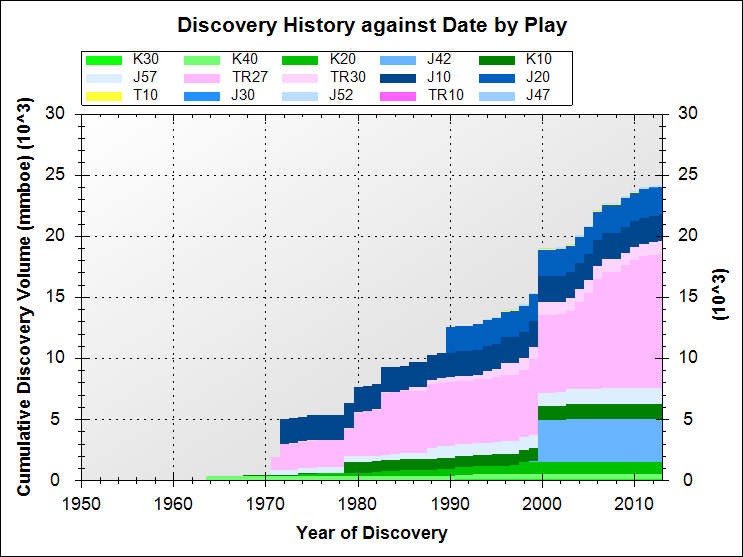
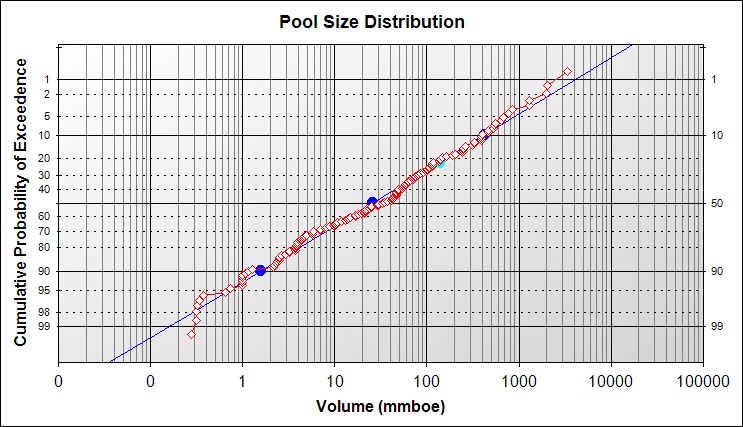
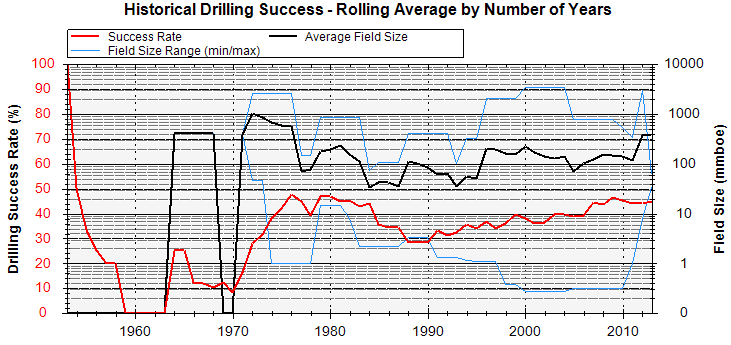
Whatever level of analysis you do the QC evaluation process helps calibrate the exploration history so that meaningful plots and maps (using your corrected data) can be made that help give insight into the remaining prospectivity. Some examples from the 30+ Player play level standard plots are shown here:
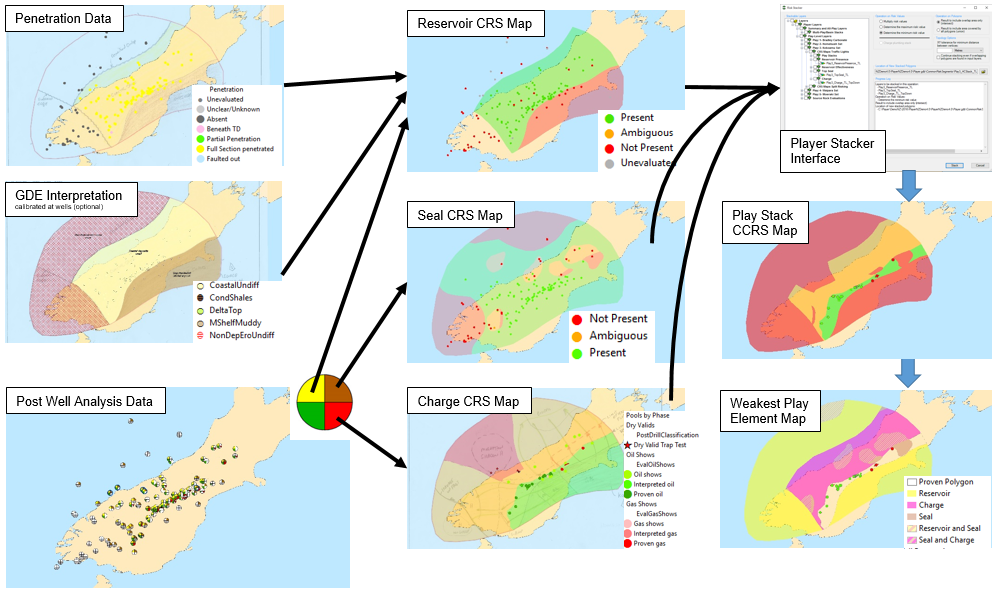
This same play element data is used to make (well calibrated) common risk segment maps which can be convolved (stacked) into different products that highlight relative prospectivity for a play interval as shown below…
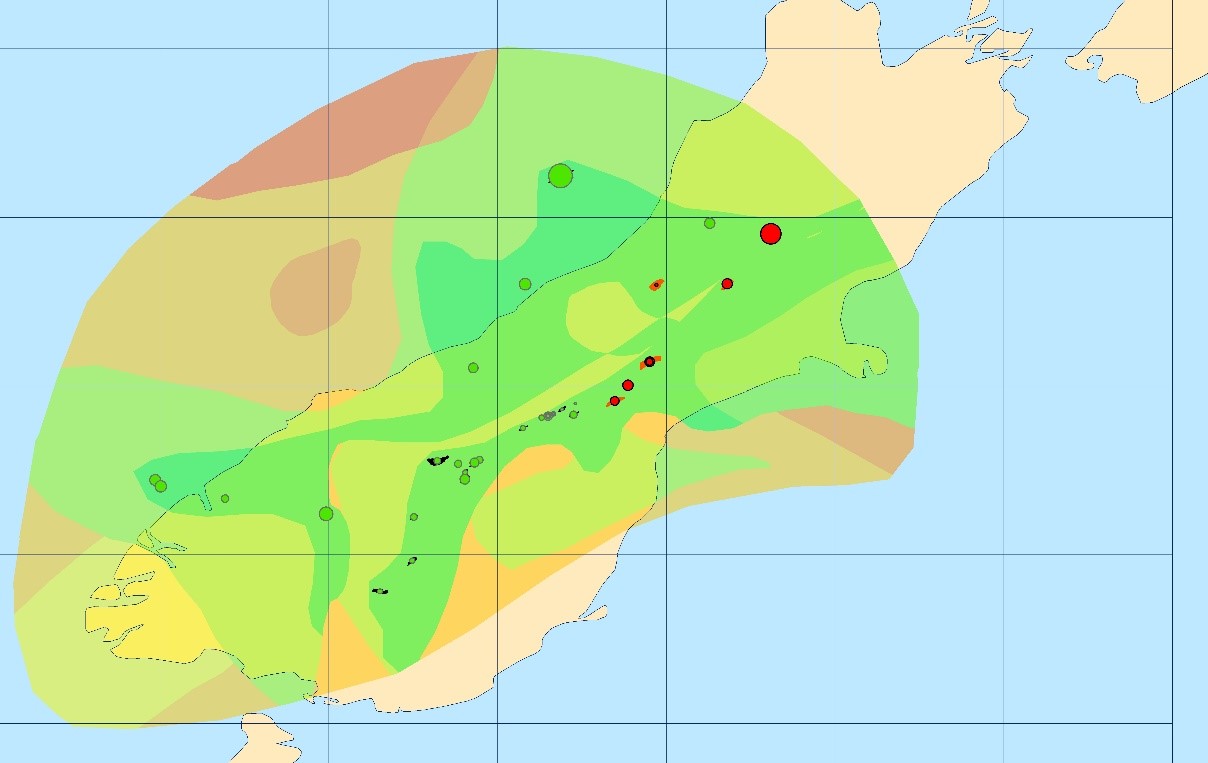
Multiple play maps can then be stacked to highlight the potential of the entire basin. We call these war maps or basin stacks and they are particularly useful for simplifying complex play analysis work into a useful output for senior management. Shown below is a 5 play level stack where the proven areas from any play interval area shown in dark green.
When we collect these data we can also use the collected well, pool, and post well analysis data to help calibrate our identified prospectivity. Specifically we can subset the exploration tests by area/polygon, play interval, trap type, facies/GDE/paleogeography, drill date, whether it was a pre-drill target and if it were amplitude supported or not. For any such subset we can then look at the success rates and discovered volumes and compare this subset to the matching prospects.
One of the user enhancements rolled out in 2016 is the addition of Player Docs functionality for wells, fields and prospects. An example is shown below for a well. Essentially the user collects the key maps/images/cross-sections in a powerpoint file that is viewable from within Player so that when a manager asks the user ‘why did you think this well failed’?, the key images can be shown instantly. They can also be updated as information changes and all of these documents are uploaded to PlayHouse with the project data when the project is uploaded and saved so that this insight is available to future users-months or maybe years later.
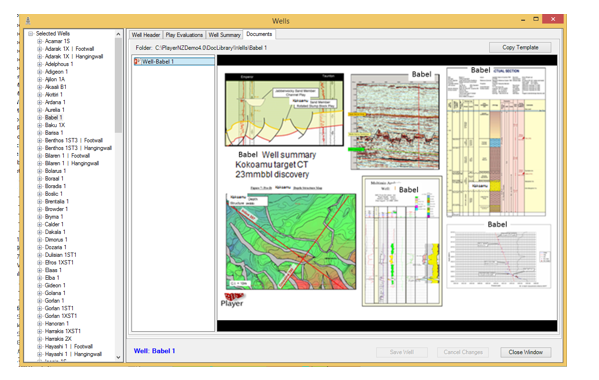
This functionality is NOT in competition with any document databases you may have in your company – you can still add hyperlinks etc as we have always offered. Typically after a period of time (as you already know) with internal company IT changes, these links do not work, however- our key images subset will be there!
Player Portfolio Analysis- Value, Risk & Block rankings
Once we have properly and efficiently evaluated our identified prospectivity against the historical exploration record we can turn to understanding what the future might hold. This can be done in many ways but normally it is a two step process:
1. In areas where we do not have detailed prospect mapping, we make an estimate of the likely frequency and size of possible/postulated prospects.
2. We integrate all of the known and postulated data and make prospectivity rankings by play interval and permit/blocks.
This summation into blocks is key- this is the commercial unit of currency that we deal with in exploration. The divestment and acquisition process which deals with these blocks is normally a continuous process. Portfolio Analysis is a unique feature of Player and uses all of the information from past and present wells that have been included in the well failure analysis and inputs of items such as drilling costs, value etc.
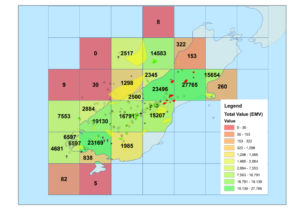
In Player, the user can select which play levels are included, subset which prospect or feature density estimate polygons (we call unidentified prospectivity) are enrolled, and decide which set of polygons to output the summation into. Usually this output is into blocks but it could be basins or any other set of polygons. We offer the functionality to make map estimates of drilling cost, value (oil, condensate and gas unit values) and tax factors so that a value can be ascribed to the plays and blocks if desired. This calculation engine unitises, by area, every pool and prospect in the selection automatically using the block boundary lines and the total value and risked volume calculation involves the generation and analysis of 7 intermediate polygon stacks. The input and output process to access this functionality is easy in Player– the computations are very complex and spatial but repeatable – we have done that hard work for you.
Indicative outputs are shown below…
Block risked volume or valuation maps
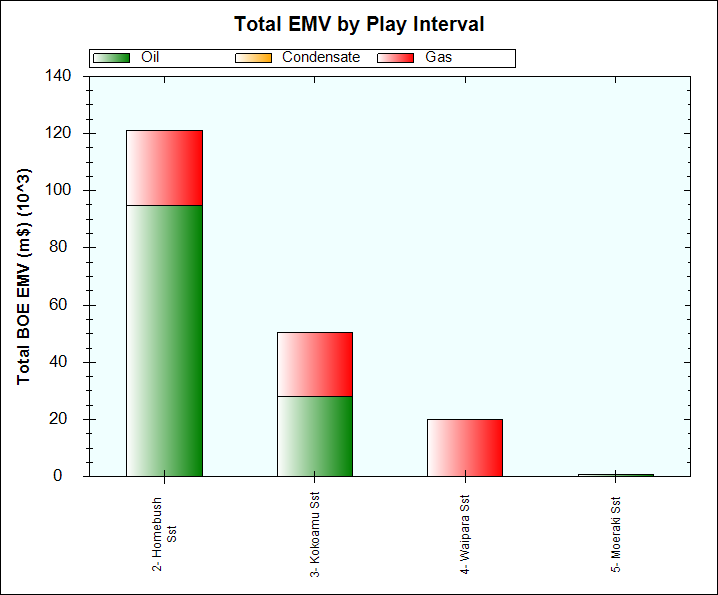
Play risk volumes and valuation rankings
Why Player vs. Other Tools?
Player includes all of the functionality found in PlayPen and as a conventional/unconventional pairing, none of our competitors offer anything as comprehensive and powerful as Player/PlayPen.
PlayPen is a subset of the Player standalone product, is cost effective, and is sold under the same licensing model and structure as Player. We believe that PlayPen has more functionality than all of our competitor’s frontline products.
The engine for grid or polygon analysis in our Unconventional tool ‘PlayPen’ is Excel. The user (typically with our support desk help) decides what the analysis of grids or polygons will be and the excel sheet is the actual engine that drives the required output. We have done this because every geologist uses excel as a base tool and in this way complex calculations like gas expansion factors or economic evaluations requiring distance measurements and data etc can be easily made into maps for qualitative or quantitative analysis.